Research is worthless unless it fuels the design process. Once the fieldwork is done, we need additional tools to help us make sense of what we've got. I have been using a variant of the KJ Method (developed by Jiro Kawakita in the 60s, similar to Affinity Diagrams) for years in my course, but recently I've begun to beef up the process by which we analyze what results. I've begun to assemble a deck of analytical aids to help guide students' thinking into areas they might not automatically consider. I've found many methods in use for fieldwork and am developing an aid to reduce the complexity of navigating that decision (discussed in the previous post), but to date I haven't found many aids for making sense of the the analysis process.
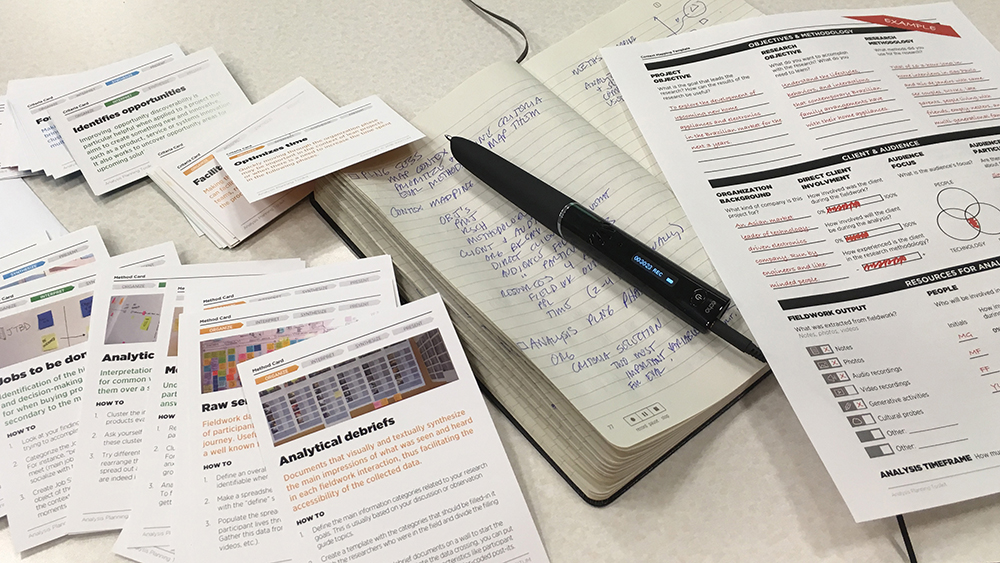
In practice, designers always work in a multidisciplinary team and research findings are interpreted by a number of different specialists: designers, human factors engineers, anthropologists—the list varies according to the needs of the project. In student work and also in small design firms, those multiple viewpoints may not exist. The deck consists of lists of questions that we can "ask" the data—questions that an anthropologist might ask, or a cognitive scientist, or an engineer, or a management consultant.
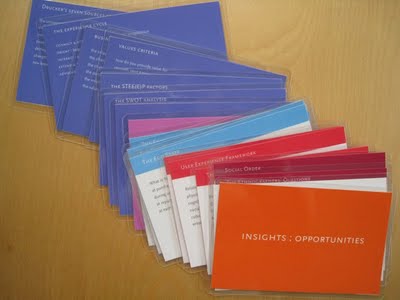
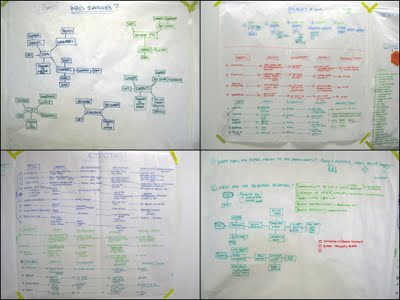
Students stand in front of the wall of data and work their way through the deck, each card acting as a lens through which they view the data. The deck is in two parts: an insight deck and an opportunity deck. The first part helps reveal important insights that might fuel design opportunities. We work slowly and methodically through the deck, making an effort to find—even force—connections between the questions and the data.
The insights are listed, mapped, or arranged in diagrams, as needed. The second deck is used to create and validate the design opportunities represented by each insight.
This process takes two or three weeks, at least. At the end, we link the insights to opportunities for design intervention, seeking quantity, quality, depth, and range: products, experiences, and business models from near term to blue sky, mild to wild. Our aim is to present our clients with a robust set of insight : opportunity pairs, hooking each opportunity to the insight that inspired it.
This is a work in process. Last week at EPIC2009 I took part in an amazing workshop with John Payne from MomentDesign, who showed us an analysis framework he's been developing, and based on that excellent session (which I hope to cover in an upcoming post) I know I will be developing this further.
I'll be presenting this work at the
IDSA National Conference in Miami in a few weeks. If any of you are attending, I'd love to have the opportunity to show you more and get your feedback. See you there!
;)
 Katherine Bennett
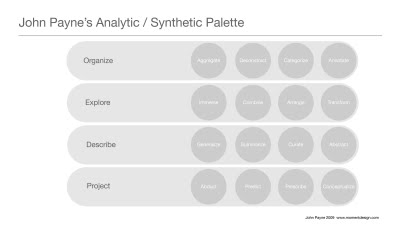

